


One of the most followed sections of the Lean Consultant blog since its establishment (although the numbers are small today) is the Lean Authors section. Despite my call last year, I am once again calling out to the Lean Thinkers eager to write.
“Write to me here about what you’re doing, what you’re seeing related to Lean! Write so that Lean Consultant becomes a platform for different voices, thoughts, and contributions at least once a month, let it become polyphonic!”
Thank God, after a little over a year, I am finally faced with a new Lean Author. He is Osman Özcan, whom I have known for many years and with whom I have collaborated on an effective Lean Transformation project, both as my colleague and my fellow citizen.
Osman Bey’s Lean Transformation journey, which started in a 40-person company where I also consulted with Hüsrev Bey in 2009, matured in medium-sized companies he worked for later, and now continues under his leadership in a global group.
It falls upon me to share his first Lean Article. I am sure this will not be his first and last article. I wish to see him more frequently around here and wish you all good readings.
To effectively reflect lean production transformation in the field and to see future improvements, it is necessary to take a good current situation snapshot.
Value analysis is the distinction of value-added and non-value-added operations in operation steps, and the identification of improvement opportunities. Usually, there are non-value-added and waste operation steps in production processes by 40-70%. These steps are usually included in product standard times and keep the product time high. A high unit time means that all budget allocations, especially capacity planning, are made incorrectly. Moreover, productivity results do not reflect the truth exactly. In fact, product prices are calculated high, and many business improvement processes can end negatively due to the inability to be competitive.
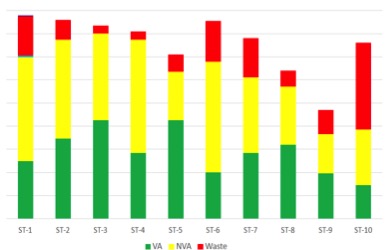
In an effectively conducted value analysis, we encounter results similar to the table above in our processes. Green colors represent value-added operations, yellow colors represent non-value-added operations, and red colors represent waste. The goal should be to eliminate waste operations marked in red and reduce the time of non-value-added operations marked in yellow. After performing these activities and rebalancing the processes, improvements of up to 20-40% can be seen.
Going to line balancing (yamazumi) without conducting these studies means accepting 7 wastes and valueless operations completely, which does not provide a significant progress in productivity. This situation also prevents us from seeing opportunities such as operation merging and station reduction.
As a result of all these, unit production costs are calculated incorrectly, and we may offer our customers a non-competitive price quotation. We may even miss a major business development process by offering too high prices due to wasteful operations. Because customers are now aware of the importance of value analysis and do not want to pay for the company’s waste. This clearly shows the necessity of starting Lean even in the quotation process.